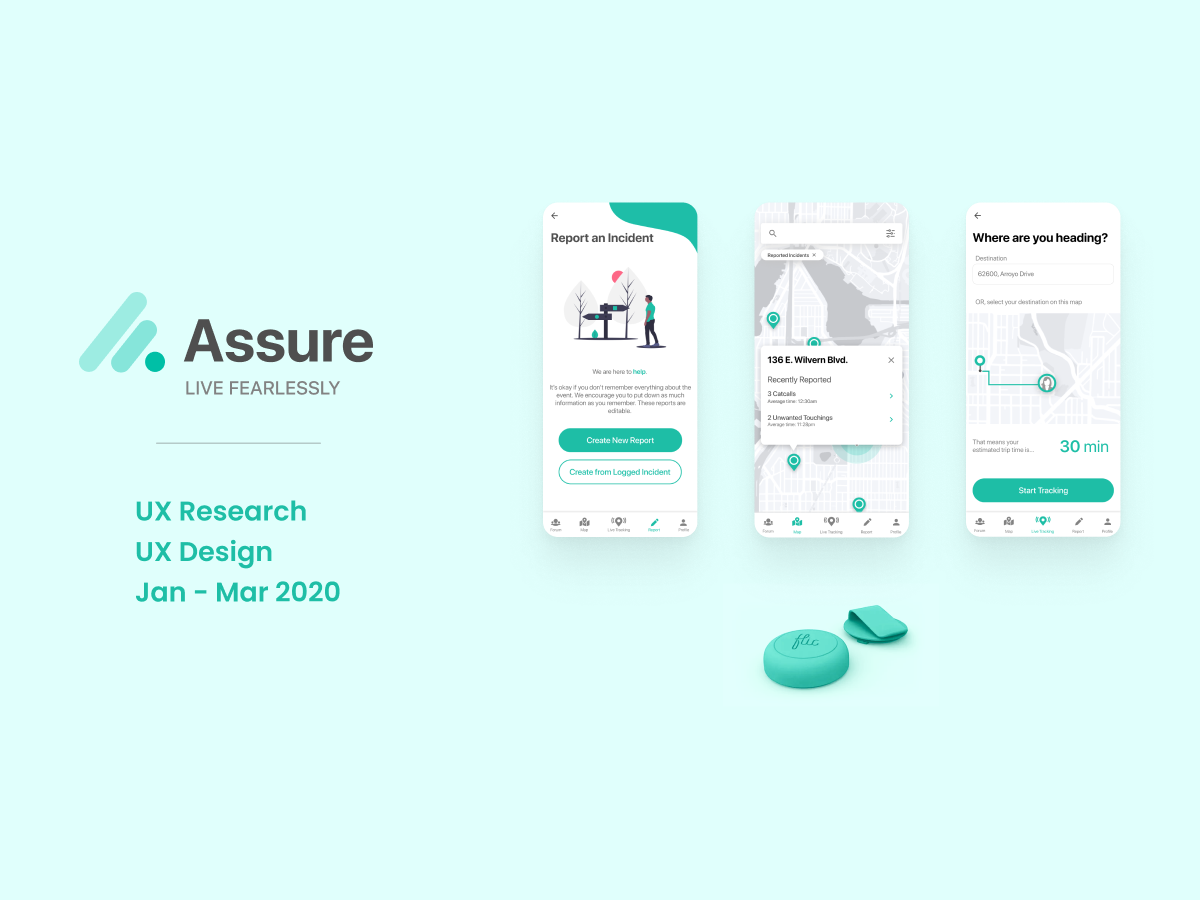
Assure: Tackling Sexual Harassment
Addressing sexual harassment using IoT technology.
Role: UX Researcher, Designer
Timeline: 8 weeks (Jan-Mar 2020)
Context: Project in User Interaction Software
Tools: Miro, UsabilityHub, Figma
Team: I collaborated with a group of 6 students including UX designers, developers, and a project manager.
. . .
The Problem
Sexual harassment is a behavior characterized by the making of inappropriate sexual remarks or physical advances in a situation. Some people take preventative measures to avoid harassment from happening; however, these measures aren’t always effective. During an uncomfortable situation, people don’t know how to react or what action(s) to take. Most people who have experienced some form of harassment prefer to either ignore it or not talk about it. This leaves people feeling unsafe at times, not knowing what actions to take and keeping painful experiences within themselves.
How might we allow people to feel safer and provide them the ability to take effective preventative measures along with action during unsafe situations?
Process Overview
Research
User Interviews
Surveys
Affinity Mapping
Design
Brainstorming
Defining features
Sketches
Low + high fidelity mockups
Interactive Prototypes
Test
Usability Testing
First Click Testing
The Solution
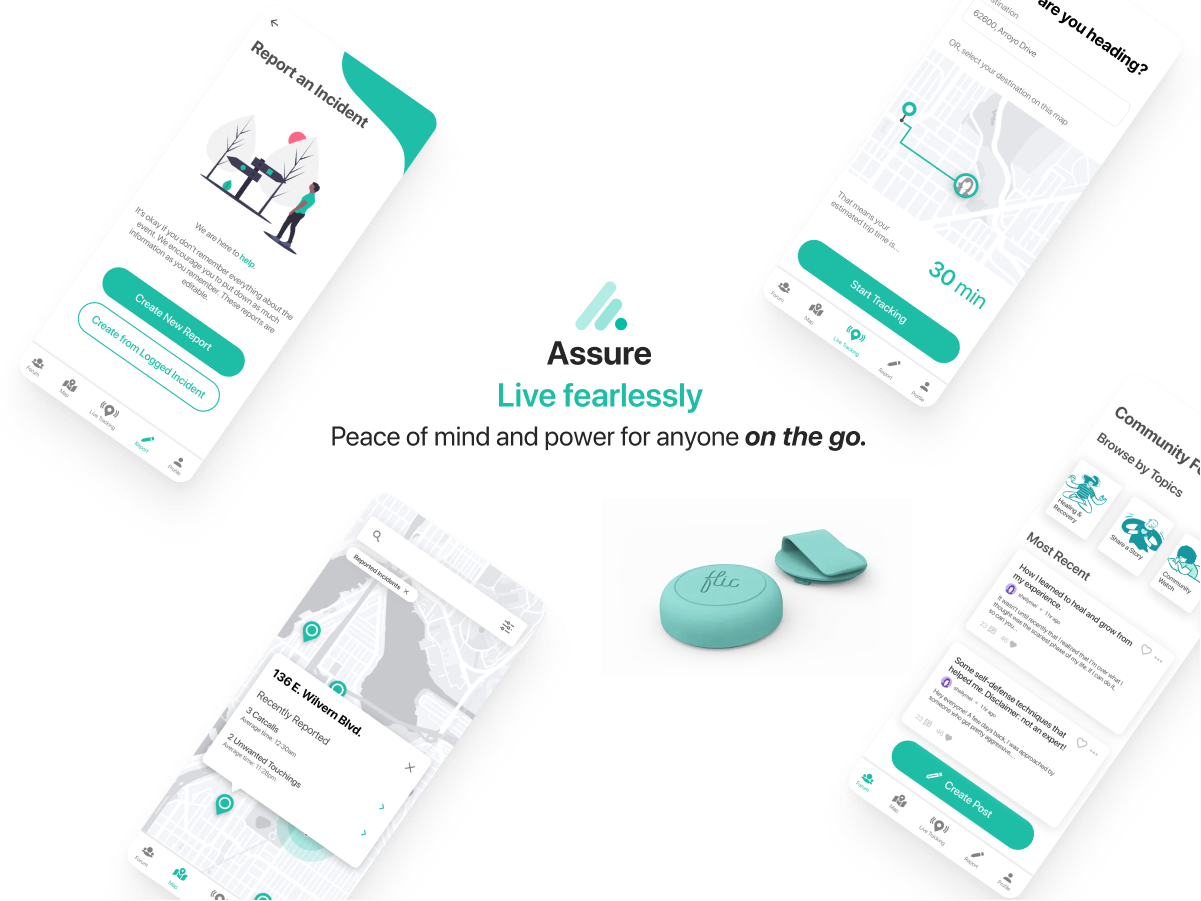
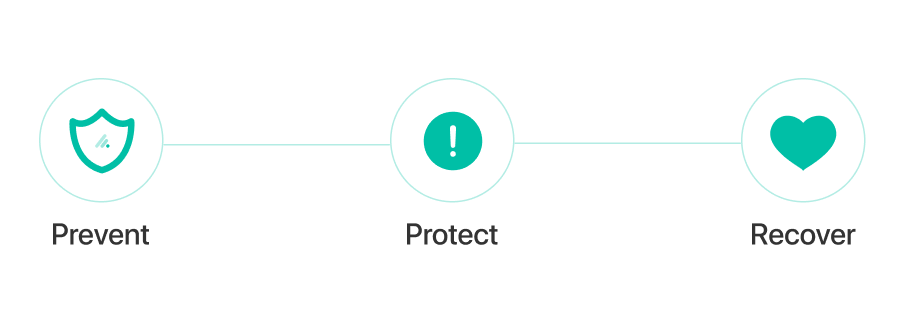
The features were narrowed down and focused on three areas - prevention, protection, and recovery.
Learn about Surrounding Areas
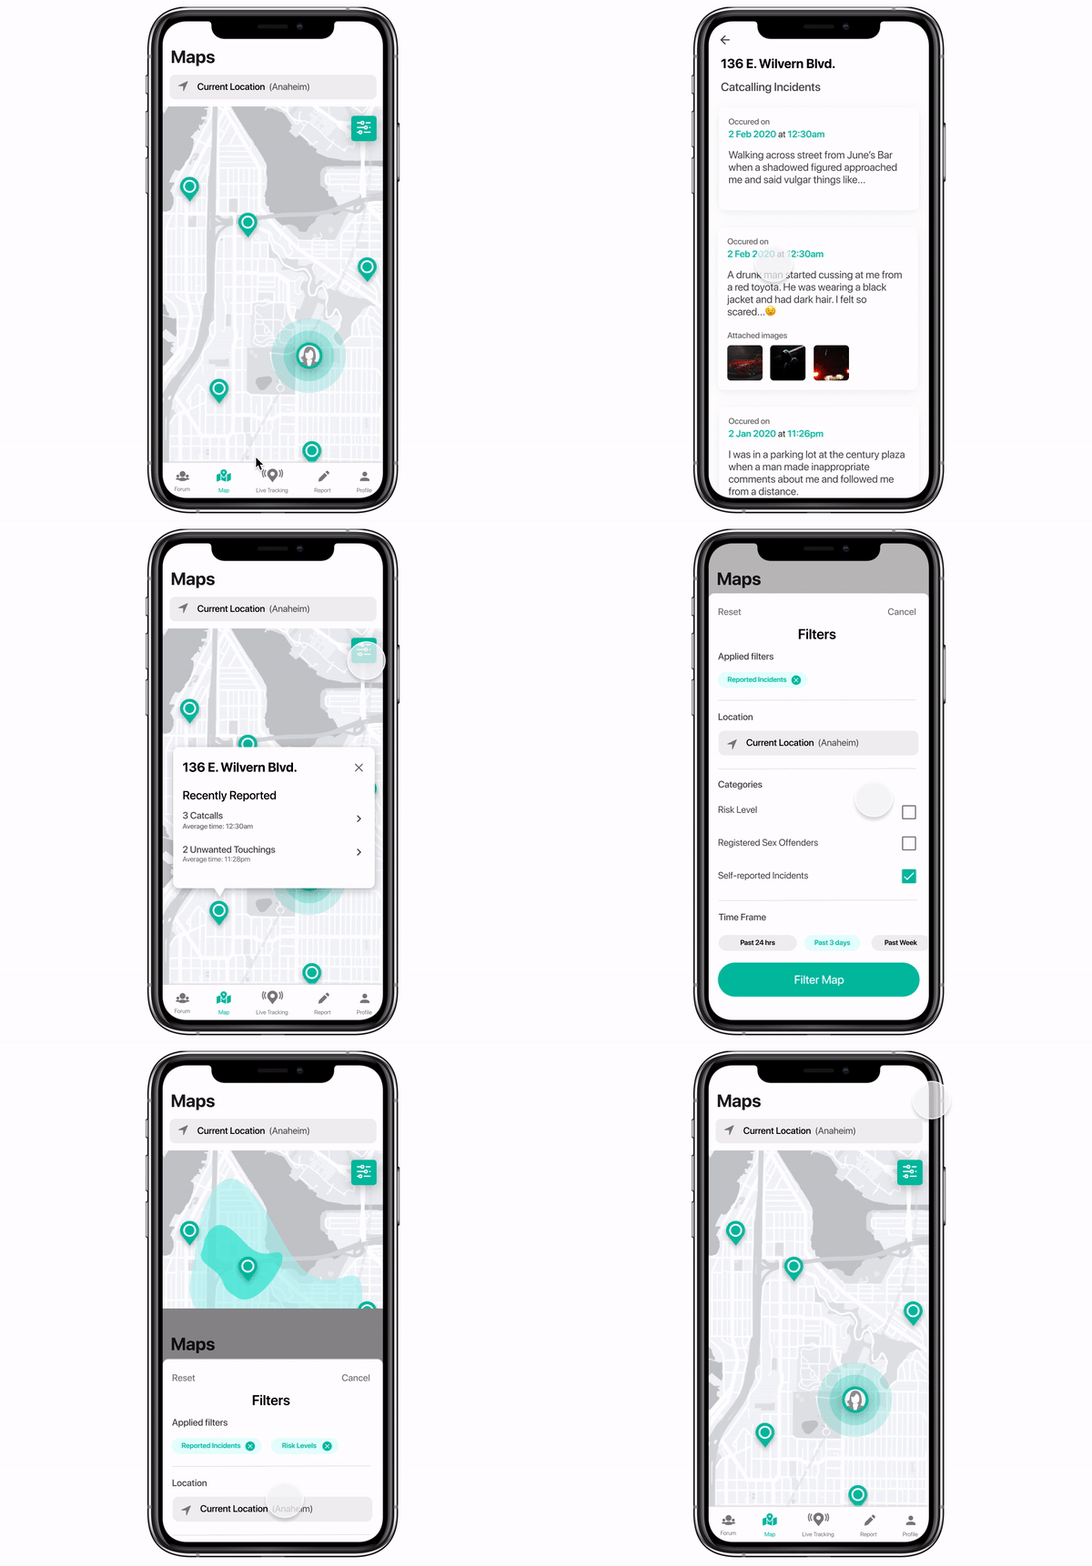
Want to know which areas to avoid ahead of time? Assure informs you about past incidents, risk levels and registered sex offenders in areas surrounding you. Precaution is at your fingertips.

Share location and Check in
Turn on live tracking using the app or the IoT device to allow your trusted contacts to keep track of you and check in with you at regular time intervals.

Report an incident
Anonymously share details of any kind of harassment that you might have experienced to inform the community of your situation.
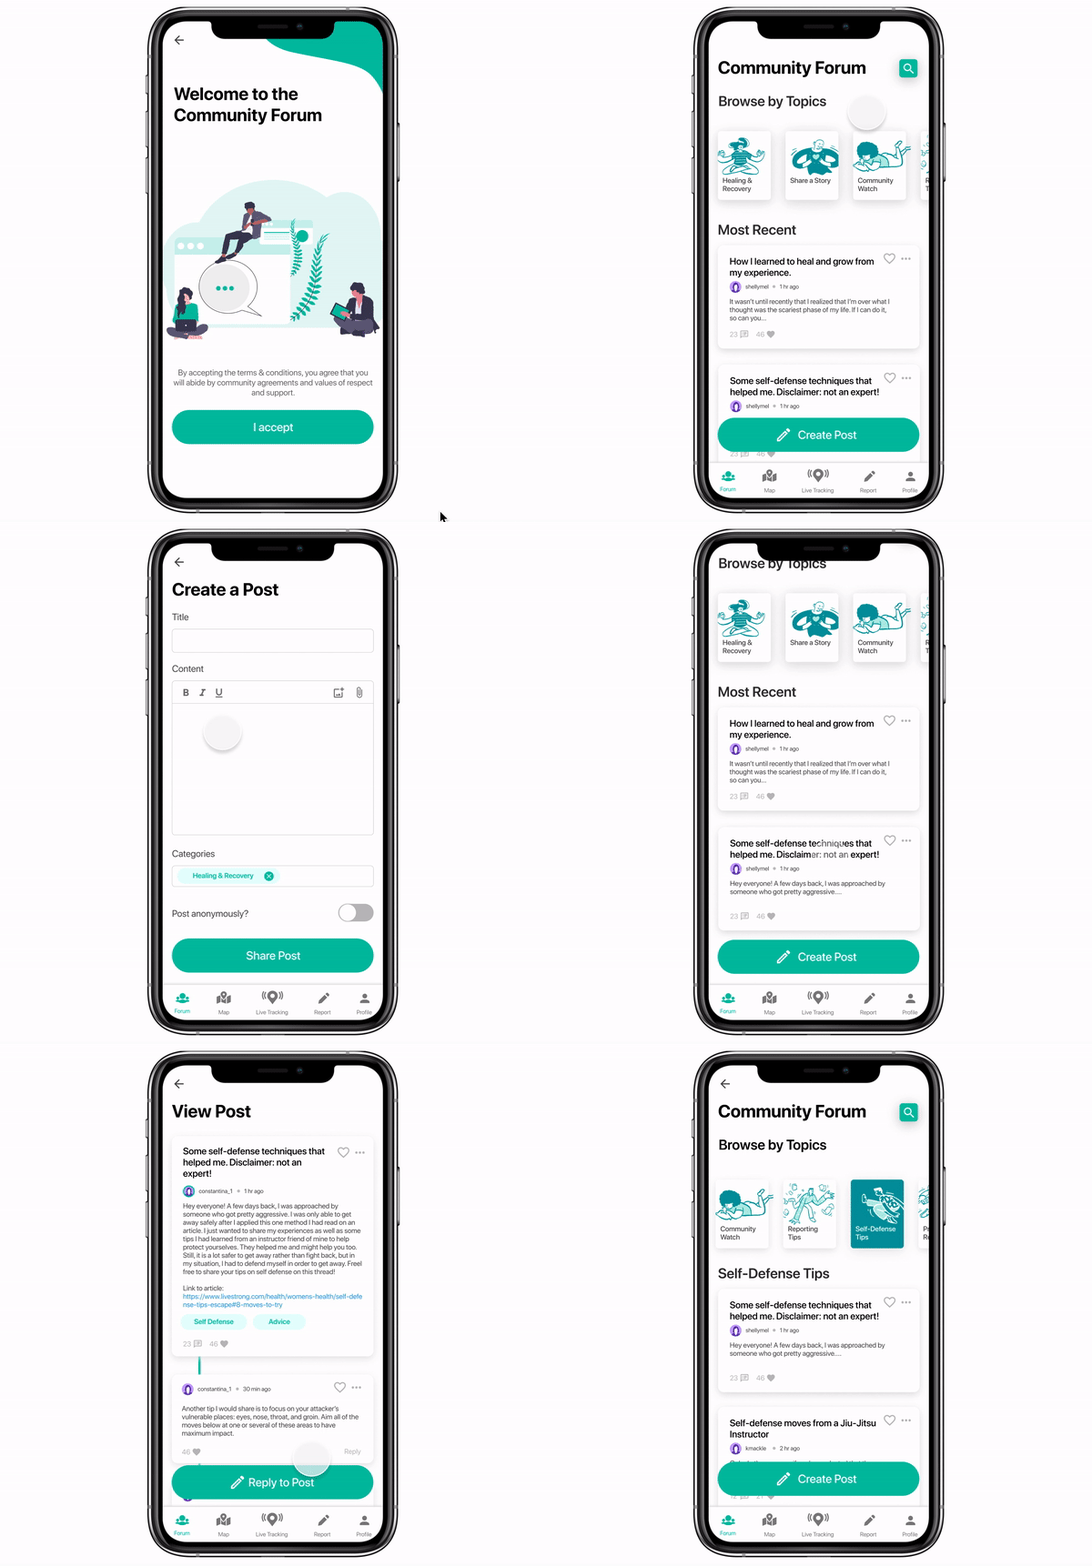
Engage with the community
Learn about how people healed from past experiences with harassment, anonymously share your experiences and add comments.
My Role
My primary role for this project was User Experience Researcher. I advocated for understanding users through interviews, surveys, usability tests and first-click tests and led all research and brainstorming activities with my team. Along with my teammates, I analyzed 120+ survey responses as well as data from interviews. I also designed and iterated upon the maps feature based on user feedback.
. . .
Research
Interviews
We conducted 6 semi-structured interviews with people who might have personally experienced harassment or knew someone else who had experienced it. Our goals for the interviews were to understand:
How do people define sexual harassment?
When and why do people feel unsafe?
What actions and protective measures do people take to feel safe?
We asked questions such as “Do you feel afraid during any circumstances or a place?” “What kind of protective measures do you normally take?” “Do those protective measures make you feel safe enough?”
Surveys
We created a survey with 17 questions to get insights on :
When do people feel most unsafe?
Where and what form of harassment do people experience the most?
How effective are preventative measures that people take?
How often do people report such incidents?
We received 126 survey responses, 76% of which were from females.
Analysis and Takeaways

We created an affinity map to identify themes between qualitative responses. We used data from the surveys to inform insights from interviews and vice versa. The key takeaways included:
Presence of other people helps thwart potential advances.
People avoid walking at night and/or in dangerous areas.
People find that reporting an incident is unnecessary.
Not enough time to react during any uncomfortable situation


. . .
Design
Defining Features + User Flows
Based on insights from the research, my team conducted a brainstorming session where we discussed ideas for potential features, options for the IoT device and prioritized user flows. The target user flows we decided to focus on were:
Live Tracking - allowing people to not only share their location with friends/family using the app or IoT wearable but also check in with them at regular time intervals.
Panic Alert/Alarm - allowing people to react quickly and appropriately during an uncomfortable situation.
Maps - giving people a visualization of potentially dangerous/high risk areas and safer areas.
Reporting - providing people the ability to submit reports of an incident with as less hassle as possible.
Community Forum - giving people a safe space to share their stories anonymously and find support or strategies to heal from any past uncomfortable experiences.

Sketches
Each team member created individual sketches. We then got together to find similarities and differences among the sketches and narrowed down to an approach for each user flow.
Low fidelity mockups + Prototypes
Along with my co-designer, I created low-mid fidelity prototypes for the primary user flows. In additon, we created a bracelet paper prototype for the potential wearable IoT device and defined the interactions with the 2 buttons.


. . .
Testing + Iterations
User Testing - Round 1
Before moving on to high fidelity designs, I wanted to check if the designs made sense to users and that they could complete common tasks without much confusion. We wrote a test script that included 7 scenarios + tasks and recruited 8 participants for the think aloud usability test. We used the Figma Mirror app on iPhone to test on the device. As a team, we created an affinity map (using Miro) to categorize users’ feedback.


The key issues identified from users’ feedback were:
Confusing icons on the tab bar.
Unclear instructions and wording for the reporting and maps feature.
Difficulty learning and memorizing gestures for IoT device.
Icon Revisions + first click tests
Users were unsure about the icon on the tab bar that signified ‘live tracking’. To address this confusion, I created 3 potential alternatives for the live tracking icon and conducted first click testing using UsabilityHub to evaluate which icon would be the best alternative. We made sure that the tests were sent to different users to avoid any overlaps in responses.


Design Improvements
Maps and filters
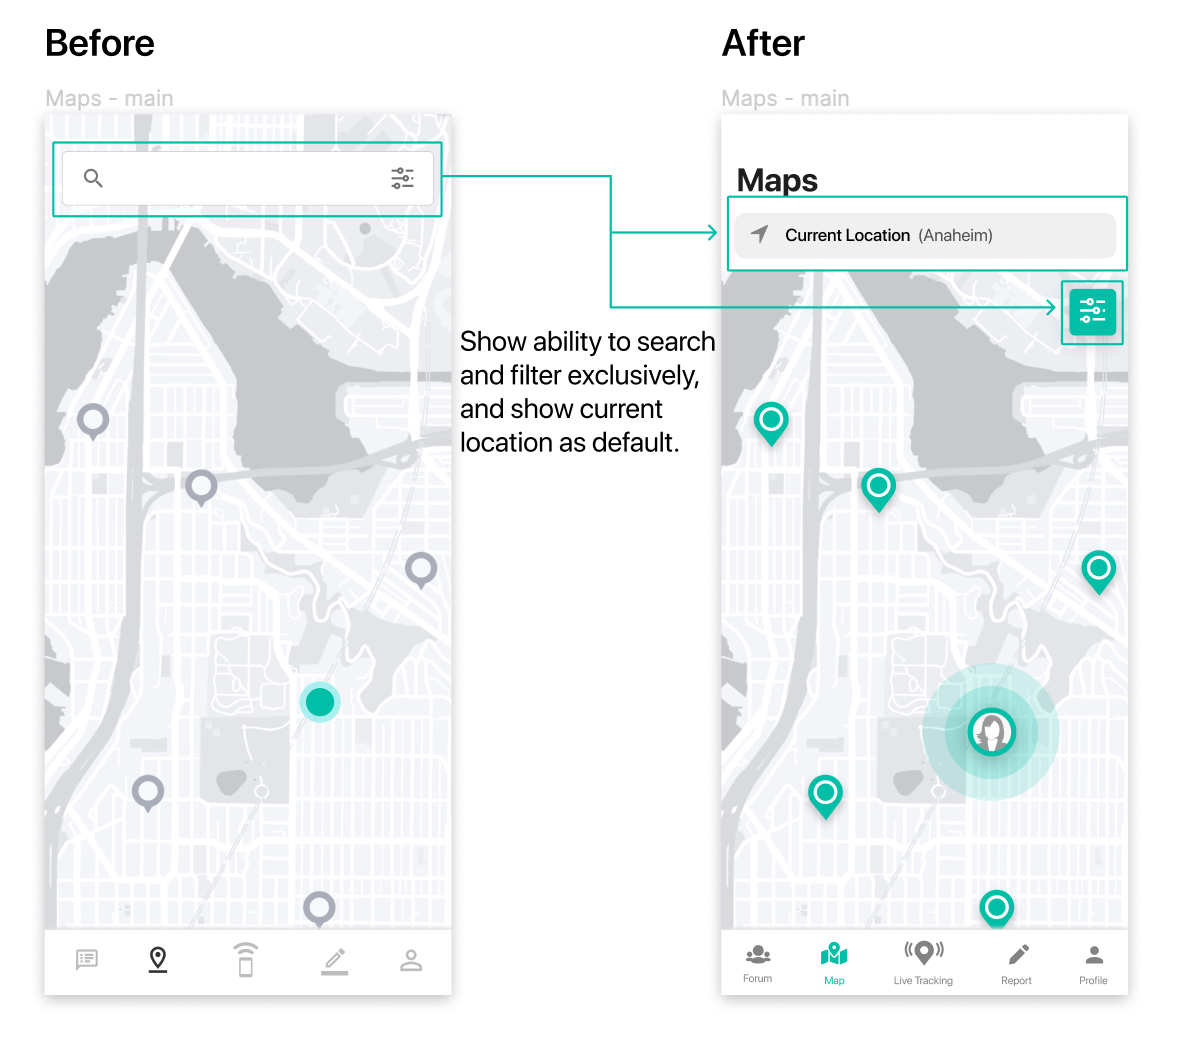
Users thought that filters on the map would apply only after searching for a particular location, however, the filters could be applied at any time. The search bar and filters icon was separated to show that they were mutually exclusive options. Further, users wished to choose when/where incidents had occurred which led to us adding additional filter options. Colors of the risk levels were edited to a gradient since we wanted to address accessibility for the color-blind population. Pins on the map were edited to show a high-level overview of reported incidents that could be expanded to display further details about the incidents reported for that specific location.



Reporting an incident
The product addresses two ways of reporting an incident 1) creating a new report from scratch and 2) creating a report from a recorded incident (while an alert was sent to emergency contacts during live tracking). Based on usability tests, users took a while to understand the distinction between the two and couldn’t find the appropriate clicks easily. The redesign for this feature focuses on the user flow where we aim to create a simpler distinction between creating a new report vs. creating one from a previously logged incident. We do this by adding 2 buttons for creating a report and reducing a redundant step between ‘start report’ and filling in details about the report.


Iot Device - flic button interactions
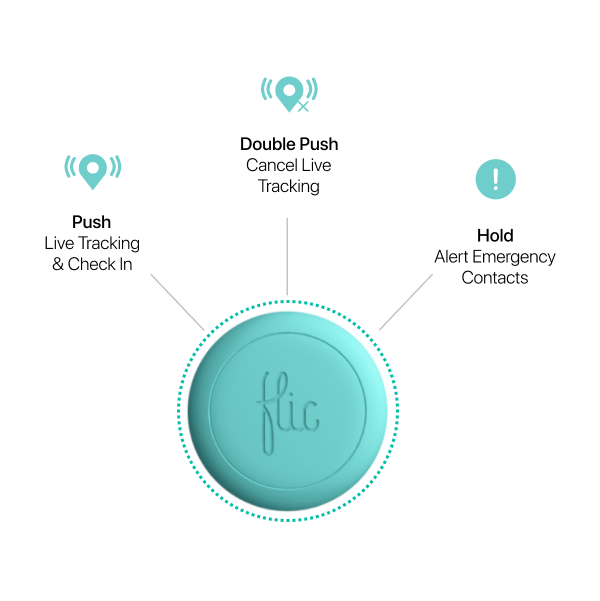
When we first tested the IoT device, we used a paper prototype and envisioned a wearable (potentially a bracelet) that would allow for a few main interactions that would allow people to take quick and effective action during an uncomfortable situation. One of the issues with that was that people had difficulty remembering gestures of the device. Upon further exploration into feasible options for an IoT device by the developers, we found the Flic Smart Button. Based on the capability of the button, we revised the interactions as follows:

Push - Live Tracking and Check in

Double Push - Cancel Live Tracking
Hold - Alert emergency contacts of danger
User Testing - Round 2
Having revised our designs and creating higher fidelity prototypes, we wanted to do another round of user testing in order to collect further user feedback. We analyzed the data with another affinity map and iterated on the designs.
Live Tracking + Check In


Final Product
. . .
Future Steps
Sending reports to designated officials - In the current version of the app, reports are stored in the backend database and connected with the maps feature where users can see high risk areas and incidents occurred based on past reports. With expansion and involvement by officials such as lawyers and the police, the app could be designed such that the reports have an option to be sent to the appropriate authorities for investigation and settlement.
Assure for the workplace - According to a recent study conducted by EEOC, “anywhere from 25% to 85% of women report having experienced sexual harassment in the workplace.” The large range of experienced harassment demands stringent methods of addressing the issue in the work environment. The app could grow to have a business plan that could be catered to specific companies such that the live tracking and reporting features are customized with the area and officials in the workplace.


